Helmerich & Payne, Inc. (HP)
$39.08+0.93%Close
SELLBEAR · day 8
Key stats
Short interest · FINRA settlement 2026-09-30
- Market cap
- $3.9B
- Beta
- 0.69
- Div yield
- 3.20%
- P/E (TTM)
- -27.91
- Short % float
- 7.17%
- Days to cover
- 5.7
- SI change
- -5.6%
- 1W
- -1.34%
- 1M
- -8.33%
- vs SPY 1W
- -1.20%
- vs SPY 1M
- -10.83%
Industry peers
FMP comparable companies · ranked by market cap
- INSWBUYInternational Seaways, Inc.$5.9BBULLQ 46$119.82+0.66%
- OIISELLOceaneering International, Inc.$4.5BBEARQ 13$44.81+0.86%
- PTENSELLPatterson-UTI Energy, Inc.$4.3BBEARQ 10$11.31+1.68%
- TDWSELLTidewater Inc.$4.2BRECOVERYQ -2$85.42+0.60%
- USACSELLUSA Compression Partners, LP$3.7BBULLQ 30$25.39
- BSMBUYBlack Stone Minerals, L.P.$3.1BBULLQ 12$14.81+0.61%
- LBRTSELLLiberty Energy Inc.$3.1BRECOVERYQ 11$19.00+0.68%
- DKLBUYDelek Logistics Partners, LP$3.0BRECOVERYQ 31$56.49+0.59%
- CIVICivitas Resources, Inc.$2.3B$27.38
- DNNSELLDenison Mines Corp.$2.2BCRISISQ 7$2.43-1.69%
Prediction markets
Kalshi · Polymarket · … linked
Loading markets…
FUNDAMENTALS
[SCORES & PROFILE]
- FUND
- 5
- VALUE
- 0
- GROWTH
- 44
- GARP
- 6
- TYPE
- Dividend Compounder
Composite of Value · Growth · GARP
ROIC-3.2%
REV YoY-
ROE-5.3%
EPS YoY-
ROA-2.2%
GROSS10
OP6
NET-3
[VALUATION]
P/E TTM-27.91
P/E FWD28.78
SECTOR PE14.82
INDUSTRY PE-
P/B1.52
P/FCF-
EV/EBITDA7.00
EV/EBIT-
PEG-
FCF YIELD-
RISK
INT COV-
D/E72.34
ALTMAN Z-
CURR RATIO1.96
ND/EBITDA-
BETA0.69
Company news








FAQ
- What is LOPJLB’s current signal on HP?
- LOPJLB’s latest quantitative signal on Helmerich & Payne, Inc. (HP) is SELL in a BEAR regime. Signals are updated daily.
- What market regime is HP in?
- Helmerich & Payne, Inc. (HP) is currently classified in the BEAR HMM market regime on LOPJLB.
- What does Helmerich & Payne, Inc. (HP) do?
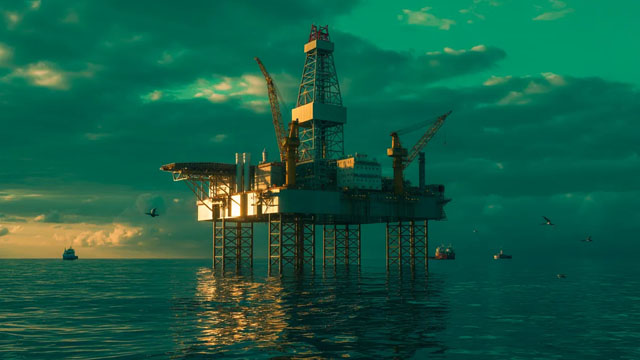
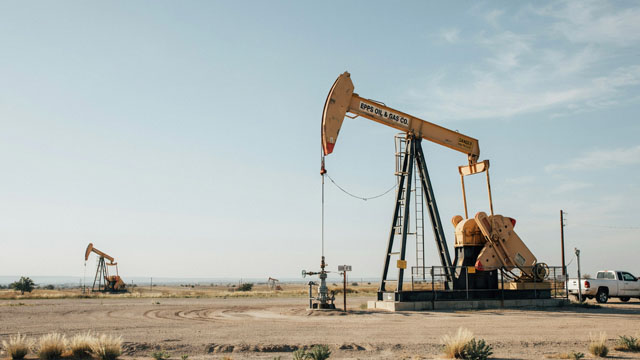
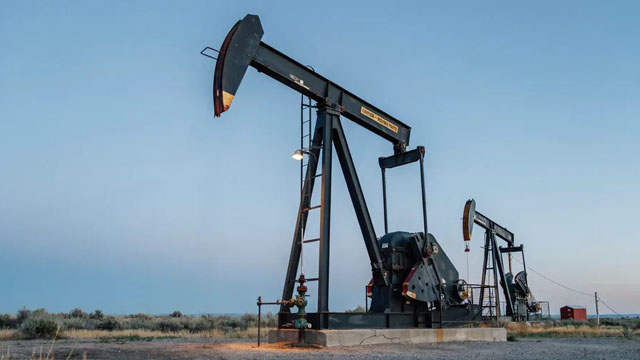
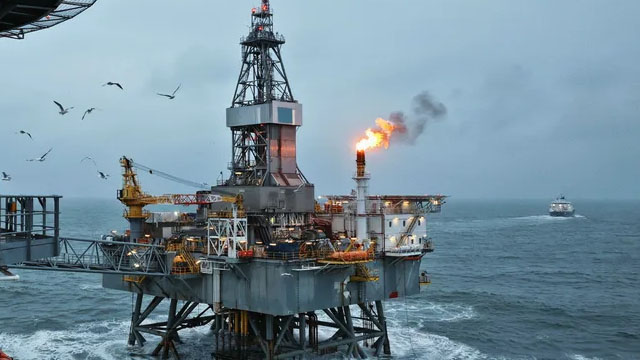
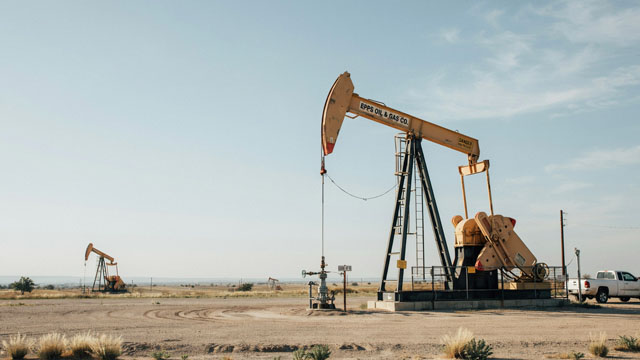
- Helmerich & Payne, Inc., along with its affiliated companies, provides specialized drilling services and innovative solutions to businesses involved in the exploration and production of oil and gas. The company's operations are strategically organized into three distinct divisions: North America Solutions, Offshore Gulf of Mexico, and International Solutions. Within the North America Solutions …