SPDR Gold Shares (GLD)
$381.67-0.13%Close
SELLBEAR · day 14
Key stats
ETF · income quality metrics
52-week IV15.4%–58.4%
- AUM
- $141.5B
- Expense
- 0.40%
- Quality
- 28
- Beta
- 0.10
- Max DD
- -26.40%
- 1Y
- +0.95%
- 3Y
- +120.85%
- 5Y
- +131.27%
- IV-%ile
- 10
- IV ATM
- 18.5%
- 1W
- -0.16%
- 1M
- -2.84%
- vs SPY 1W
- -0.02%
- vs SPY 1M
- -5.35%
Industry peers
FMP comparable companies · ranked by market cap
- IEMGiShares Core MSCI Emerging Markets ETF$164.7B$80.50
- VEMAXVanguard Emerging Markets Stock Index Fund Admiral Shares$163.6B$49.22
- VITAXVanguard Information Technology Index Fund Admiral Shares$150.1B$521.23
- VGTVanguard Information Technology ETF$148.3B$127.25
- VDADXVanguard Dividend Appreciation Index Fund Admiral Shares$128.5B$64.43
- VIGVanguard Dividend Appreciation ETF$128.5B$237.39
- VWENXVanguard Wellington Fund Admiral Shares$124.7B$81.36
- IJHiShares Core S&P Mid-Cap ETF$118.8B$73.03
- VIEIXVanguard Extended Market Index Fund Institutional Shares$96.5B$176.90
- IAUiShares Gold Trust$61.3B$77.66
Prediction markets
Kalshi · Polymarket · … linked
Loading markets…
Company news















FAQ
- What is LOPJLB’s current signal on GLD?
- LOPJLB’s latest quantitative signal on SPDR Gold Shares (GLD) is SELL in a BEAR regime. Signals are updated daily.
- What market regime is GLD in?
- SPDR Gold Shares (GLD) is currently classified in the BEAR HMM market regime on LOPJLB.
- What does SPDR Gold Shares (GLD) do?
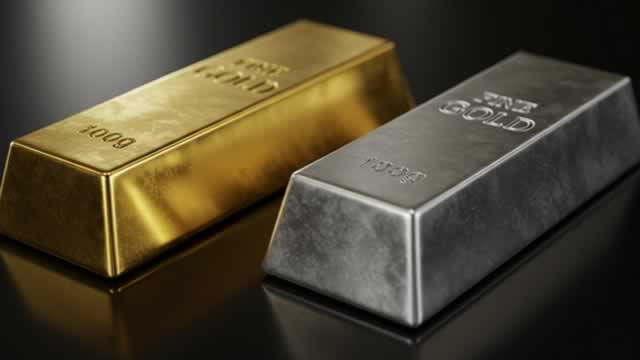
- The SPDR Gold Trust aims to mirror the market price movements of physical gold bullion, after deducting its operational expenses. This pioneering fund was the first gold exchange-traded fund (ETF) to be introduced in the U.S., and also the initial U.S.-listed ETF to be backed by a tangible asset. For a significant number of investors, the combined expenses of purchasing GLD shares on the second…